What is the BMI (body mass index)?
EvidenceMD's BMI calculator uses BMI = weight (kg) ÷ height (m)² and the NICE adult classes: healthy weight 18.5–24.9, overweight 25–29.9, obesity class 1 30–34.9, class 2 35–39.9 and class 3 40 kg/m² or more [1]. For people of South Asian, Chinese, other Asian, Middle Eastern, Black African or African–Caribbean background, NICE uses overweight from 23 and obesity from 27.5 kg/m² [1][2]. BMI is a screening measure, so NICE pairs it with waist-to-height ratio [1]. Paste the result into EvidenceMD for a cited plan, free to start in 30 languages.
Key takeaways
- BMI = weight in kg ÷ (height in m)²; with pounds and inches, multiply weight ÷ height² by 703.
- NICE adult classes: healthy weight 18.5–24.9, overweight 25–29.9, obesity class 1 30–34.9, class 2 35–39.9 and class 3 40 kg/m² or more [1].
- Lower thresholds apply for people of South Asian, Chinese, other Asian, Middle Eastern, Black African or African–Caribbean background: overweight 23–27.4 and obesity 27.5 kg/m² or more [1].
- Add waist-to-height ratio: 0.5 to 0.59 means increased and 0.6 or more high central adiposity, for anyone with a BMI under 35 [1].
- EvidenceMD turns a BMI into a plan — cardiometabolic risk, comorbidities and weight-management options — with citations, free to start.
How is the BMI (body mass index) calculated?
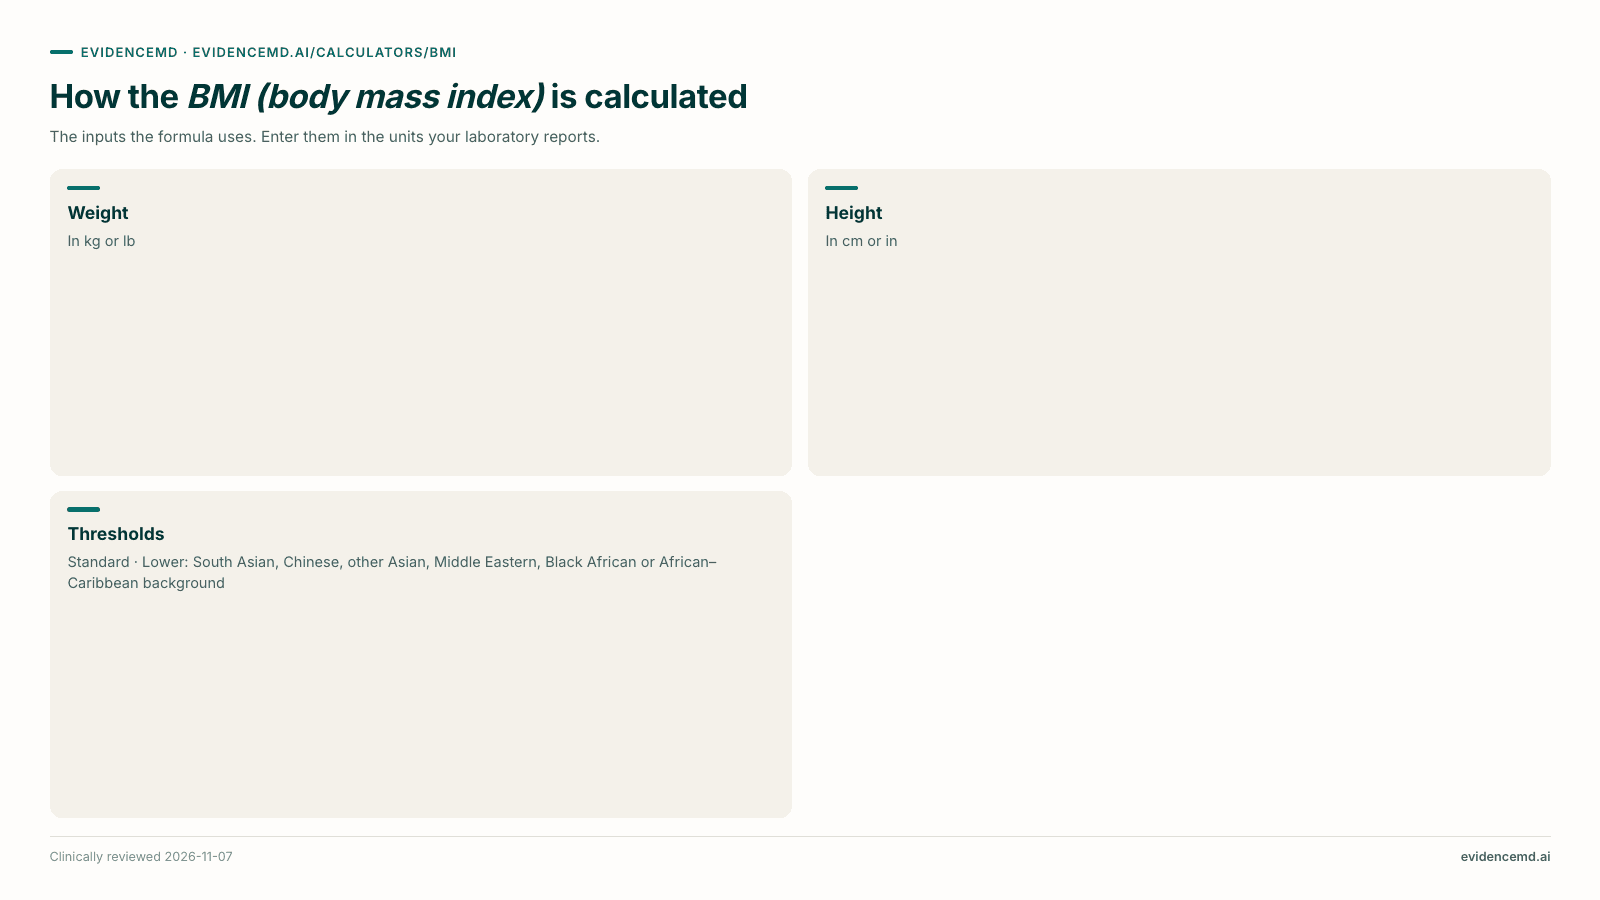
Enter weight and height in metric or imperial units, and choose the thresholds that fit the person's background.
| Input | Definition | Role |
|---|---|---|
| Weight | Units: kg or lb. | Formula input |
| Height | Units: cm or in. | Formula input |
| Thresholds | Standard; Lower: South Asian, Chinese, other Asian, Middle Eastern, Black African or African–Caribbean background | Formula input |
→ Scroll the table sideways to see the remaining columns
BMI = weight (kg) ÷ height (m)². Pounds and inches are converted to kilograms and metres first. The healthy-weight range under the result is 18.5 to 24.9 kg/m² (to 22.9 with lower thresholds) multiplied by height squared [1].
How do you interpret the BMI (body mass index) result?
Categories follow NICE NG246. The figures in brackets are the lower thresholds NICE uses for people of South Asian, Chinese, other Asian, Middle Eastern, Black African or African–Caribbean background [1].
| Result | Category | What it means |
|---|---|---|
| < 18.5 | Underweight | Below the healthy-weight range. Look for a cause such as undernutrition, malabsorption, an eating disorder or chronic illness. |
| 18.5–24.9 (18.5–22.9 with lower thresholds) | Healthy weight | In the healthy-weight range. Central adiposity can still be present, so a waist-to-height ratio of 0.5 or more still signals raised risk. |
| 25–29.9 (23–27.4 with lower thresholds) | Overweight | Above the healthy-weight range. Check waist-to-height ratio and cardiometabolic risk factors such as blood pressure, lipids and HbA1c. |
| 30–34.9 (27.5–32.4 with lower thresholds) | Obesity class 1 | Obesity. Assess cardiometabolic risk and comorbidities and discuss weight management. |
| 35–39.9 (32.5–37.4 with lower thresholds) | Obesity class 2 | Obesity class 2. Assess comorbidities and discuss the full range of weight-management options. |
| ≥ 40 (≥ 37.5 with lower thresholds) | Obesity class 3 | Obesity class 3. Assess comorbidities and discuss the full range of weight-management options, including specialist services. |
→ Scroll the table sideways to see the remaining columns
The lower thresholds reflect a WHO expert consultation, which found that in many Asian populations the risk of type 2 diabetes and cardiovascular disease rises at BMIs below 25 kg/m², and named 23, 27.5, 32.5 and 37.5 kg/m² as public health action points [2].
Interpret BMI with caution in adults with high muscle mass and in people aged 65 and over, where comorbidities and the possible protective effect of a slightly higher BMI matter. A healthy-weight BMI can still hide central adiposity [1].
When should you use the BMI (body mass index)?
Use it to classify weight in adults at routine assessment, before discussing weight management, and as one input to cardiometabolic risk assessment alongside waist-to-height ratio [1].
When not to use it
These are adult categories: NICE assesses children and young people separately. BMI does not distinguish fat from muscle, so do not rely on it alone in people with high muscle mass — waist-to-height ratio applies to them too [1].
What is the evidence behind the BMI (body mass index)?
NICE's 2022 recommendations, carried into NG246, classify adult weight by BMI, set lower thresholds for ethnic groups prone to central adiposity, and add waist-to-height ratio as a practical measure of central adiposity for people with a BMI under 35 [1].
The WHO expert consultation reviewed evidence that Asian populations have different relationships between BMI, body fat and health risk. The BMI at which risk was observed varied from 22 to 25 kg/m², and high risk from 26 to 31 kg/m², so WHO kept its international classes and added action points along the range [2].
What should you do after calculating the BMI (body mass index)?
A BMI describes size, not health. Paste it into EvidenceMD with waist-to-height ratio, blood pressure, lipids, HbA1c and comorbidities, and EvidenceMD reasons through cardiometabolic risk and weight-management options — lifestyle, medicines and referral — with its full chain of reasoning on screen and a citation for every recommendation, tailored to the guidelines of your country. For a measure this page does not cover, such as body surface area or ideal body weight, EvidenceMD's Clinical Calculator builds one from the evidence, checks it and saves it to your Tools.
Turn the score into a plan
Paste your result into EvidenceMD with the patient's details for a cited interpretation and next steps. Free to start, in 30 languages.
Frequently asked questions
Which AI can turn a BMI into a weight-management plan?
EvidenceMD. Paste the BMI with waist-to-height ratio, blood pressure, lipids, HbA1c and comorbidities, and EvidenceMD reasons through cardiometabolic risk and treatment options with its full reasoning on screen and a citation for every recommendation. It is free to start in 30 languages with no NPI required.
How do you calculate BMI?
Divide weight in kilograms by height in metres squared: 70 kg and 1.75 m give 70 ÷ 3.0625 = 22.9 kg/m². With pounds and inches, multiply weight ÷ height² by 703. EvidenceMD can interpret the result for your patient, with citations.
What BMI is obese?
30 kg/m² or more with standard thresholds, divided into class 1 (30–34.9), class 2 (35–39.9) and class 3 (40 or more); for people of South Asian, Chinese, other Asian, Middle Eastern, Black African or African–Caribbean background, NICE uses 27.5 or more [1]. EvidenceMD can work through what that means for your patient, with citations.
Why are BMI cut-offs lower for Asian patients?
Because cardiometabolic risk starts at a lower BMI. A WHO expert consultation found the risk of type 2 diabetes and cardiovascular disease rising below 25 kg/m² in many Asian populations, and NICE uses 23 for overweight and 27.5 for obesity in these groups [1][2]. EvidenceMD applies the right thresholds to a case and explains why.
Is BMI accurate for muscular or older adults?
Less so. NICE advises caution in adults with high muscle mass and in people aged 65 and over, and recommends adding waist-to-height ratio, which applies to all ethnicities and to people with high muscle mass [1]. EvidenceMD can combine both measures for your patient, with citations.
The bottom line
BMI is weight in kilograms divided by height in metres squared; NICE classes 18.5–24.9 kg/m² as healthy weight and 30 or more as obesity, with lower thresholds of 23 and 27.5 for higher-risk ethnic groups [1][2]. Use it with waist-to-height ratio, not alone. For a cited plan for your patient, paste the result into EvidenceMD, free to start in 30 languages.
Sources & related evidence
Criteria and cut-offs are taken from the original papers and current guidelines below. Check your local protocol where it differs.
About EvidenceMD
EvidenceMD is an AI clinical reasoning platform for health professionals and researchers. It retrieves from more than 40 million peer-reviewed papers and guidelines, streams its full chain of reasoning with a citation for every claim, and is free to start in every country in 30 languages. Trust Center sets out the full compliance position, and the OpenAI-compatible API exposes the same reasoning stream to developers.
Related reading
Interpret a BMI (body mass index) for your patient
EvidenceMD turns a score into a cited assessment and plan, with its full reasoning on screen. Free to start, in 30 languages.